Those improving their sailing performance or at least tweaking the last 0.1 kts out of their boats, NMEAremote could help by handling a polar diagram.
Once imported into the Performance module and together with the current true wind speed and angle, NMEAremote calculates and displays all necessary performance values like: Polar Speed, Target Speed, VMG, Beat & Gybe angels & VMGs.
What is a Polar?
In a few words a Polar contains a collection of boat speeds at selected relative true wind angles (TWA) and speeds (TWS) telling you how fast your boat will sail at these conditions. These called Polar Speeds could be either predicted with a VPP (Velocity Prediction Program) by the boat designer, sailmaker, ORC certificate or they are measured, recorded and processed for all wind angles and speeds.
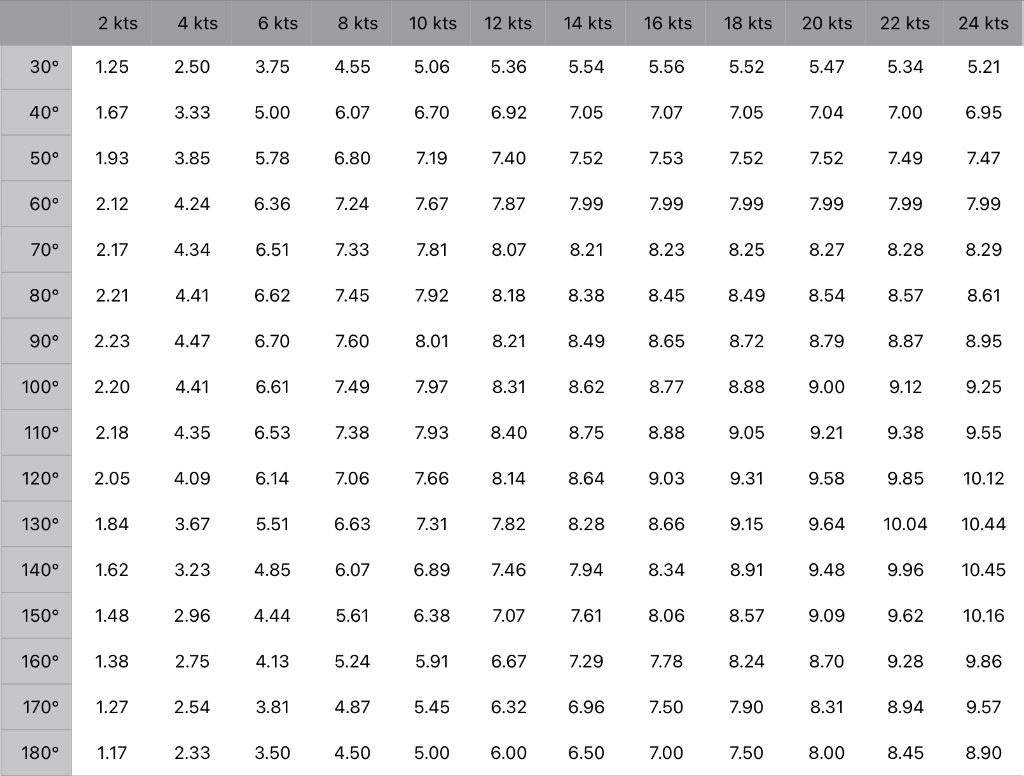
A Polar has two representations. One is the Polar Table, a matrix or sheet with rows for each TWA and columns for each TWS.
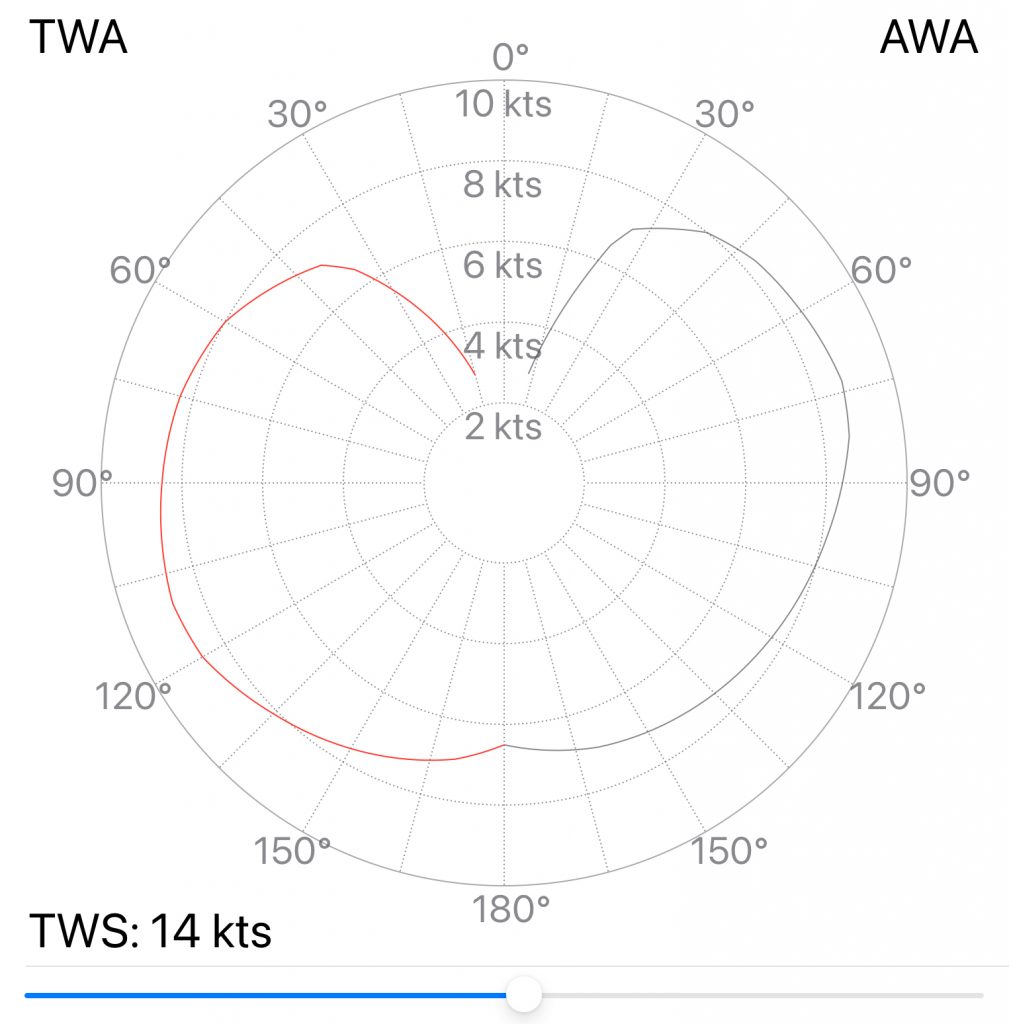
The second representation is the Polar Diagram, a polar chart or plot for a better visualisation. Each plot shows the polar speeds for one TWS. The angle in the diagram represents the TWA and the distance to the center is the polar speed. Some diagrams are showing several plots for selected TWSs in different colours. Because the polar speeds should be the same on port and starboard tack (in theory), only a half diagram is shown often. For better visibility NMEAremote shows only one plot for a selectable TWS.
Please keep in mind that all polar speeds are related to TRUE wind angels & speeds because the boat motion should not go into the calculations.
Sometimes it is useful to see also the AWA (Apparent Wind Angle) and NMEAremote calculates them from the TWA and the Polar Speed. This AWA conversion is shown in the right half of the polar diagram.
What you’ll get from the Polar?
Assuming NMEAremote has a loaded polar and the current TWA and TWS is available. The first value would be the Polar Speed for the given TWA/TWS. This is the speed your boat (or you) should sail. Because the current wind situation (e.g. TWA of 47° and TWS of 11.5 kts) won’t fit the grid of the polar the most time, NMEAremote interpolates between the polar points.
Next the polar speed could be compared to the current boat speed. This gives the Polar Speed Percent value, showing your current performance and at least if you should adjust something.
One thing I’m very proud of is a bar indicator below the speed readout showing the polar speed percentage. This is unique and I’ve never seen this anywhere else.

Now having a clear picture of speed and performance this brings us to the then next question: Where to go or which direction brings us as quickly as possible to our target?
Assume you want a reach a windward target and have to tack upwind. You can point very high with a lower speed or fall off with higher speed. The question is which course is the optimum? The answer is in the VMG (Velocity Made Good). The VMG value is the velocity component towards (or from) the direction of the wind.
In a polar diagram you can see directly the VMG for any wind angle as the vertical portion on the 0° scale by just drawing a horizontal line.
The highest horizontal line or simply the highest point on the plot is showing the highest VMG (upwind). So the TWA at the point of the plot is the TWA where the VMG for beating is the best.
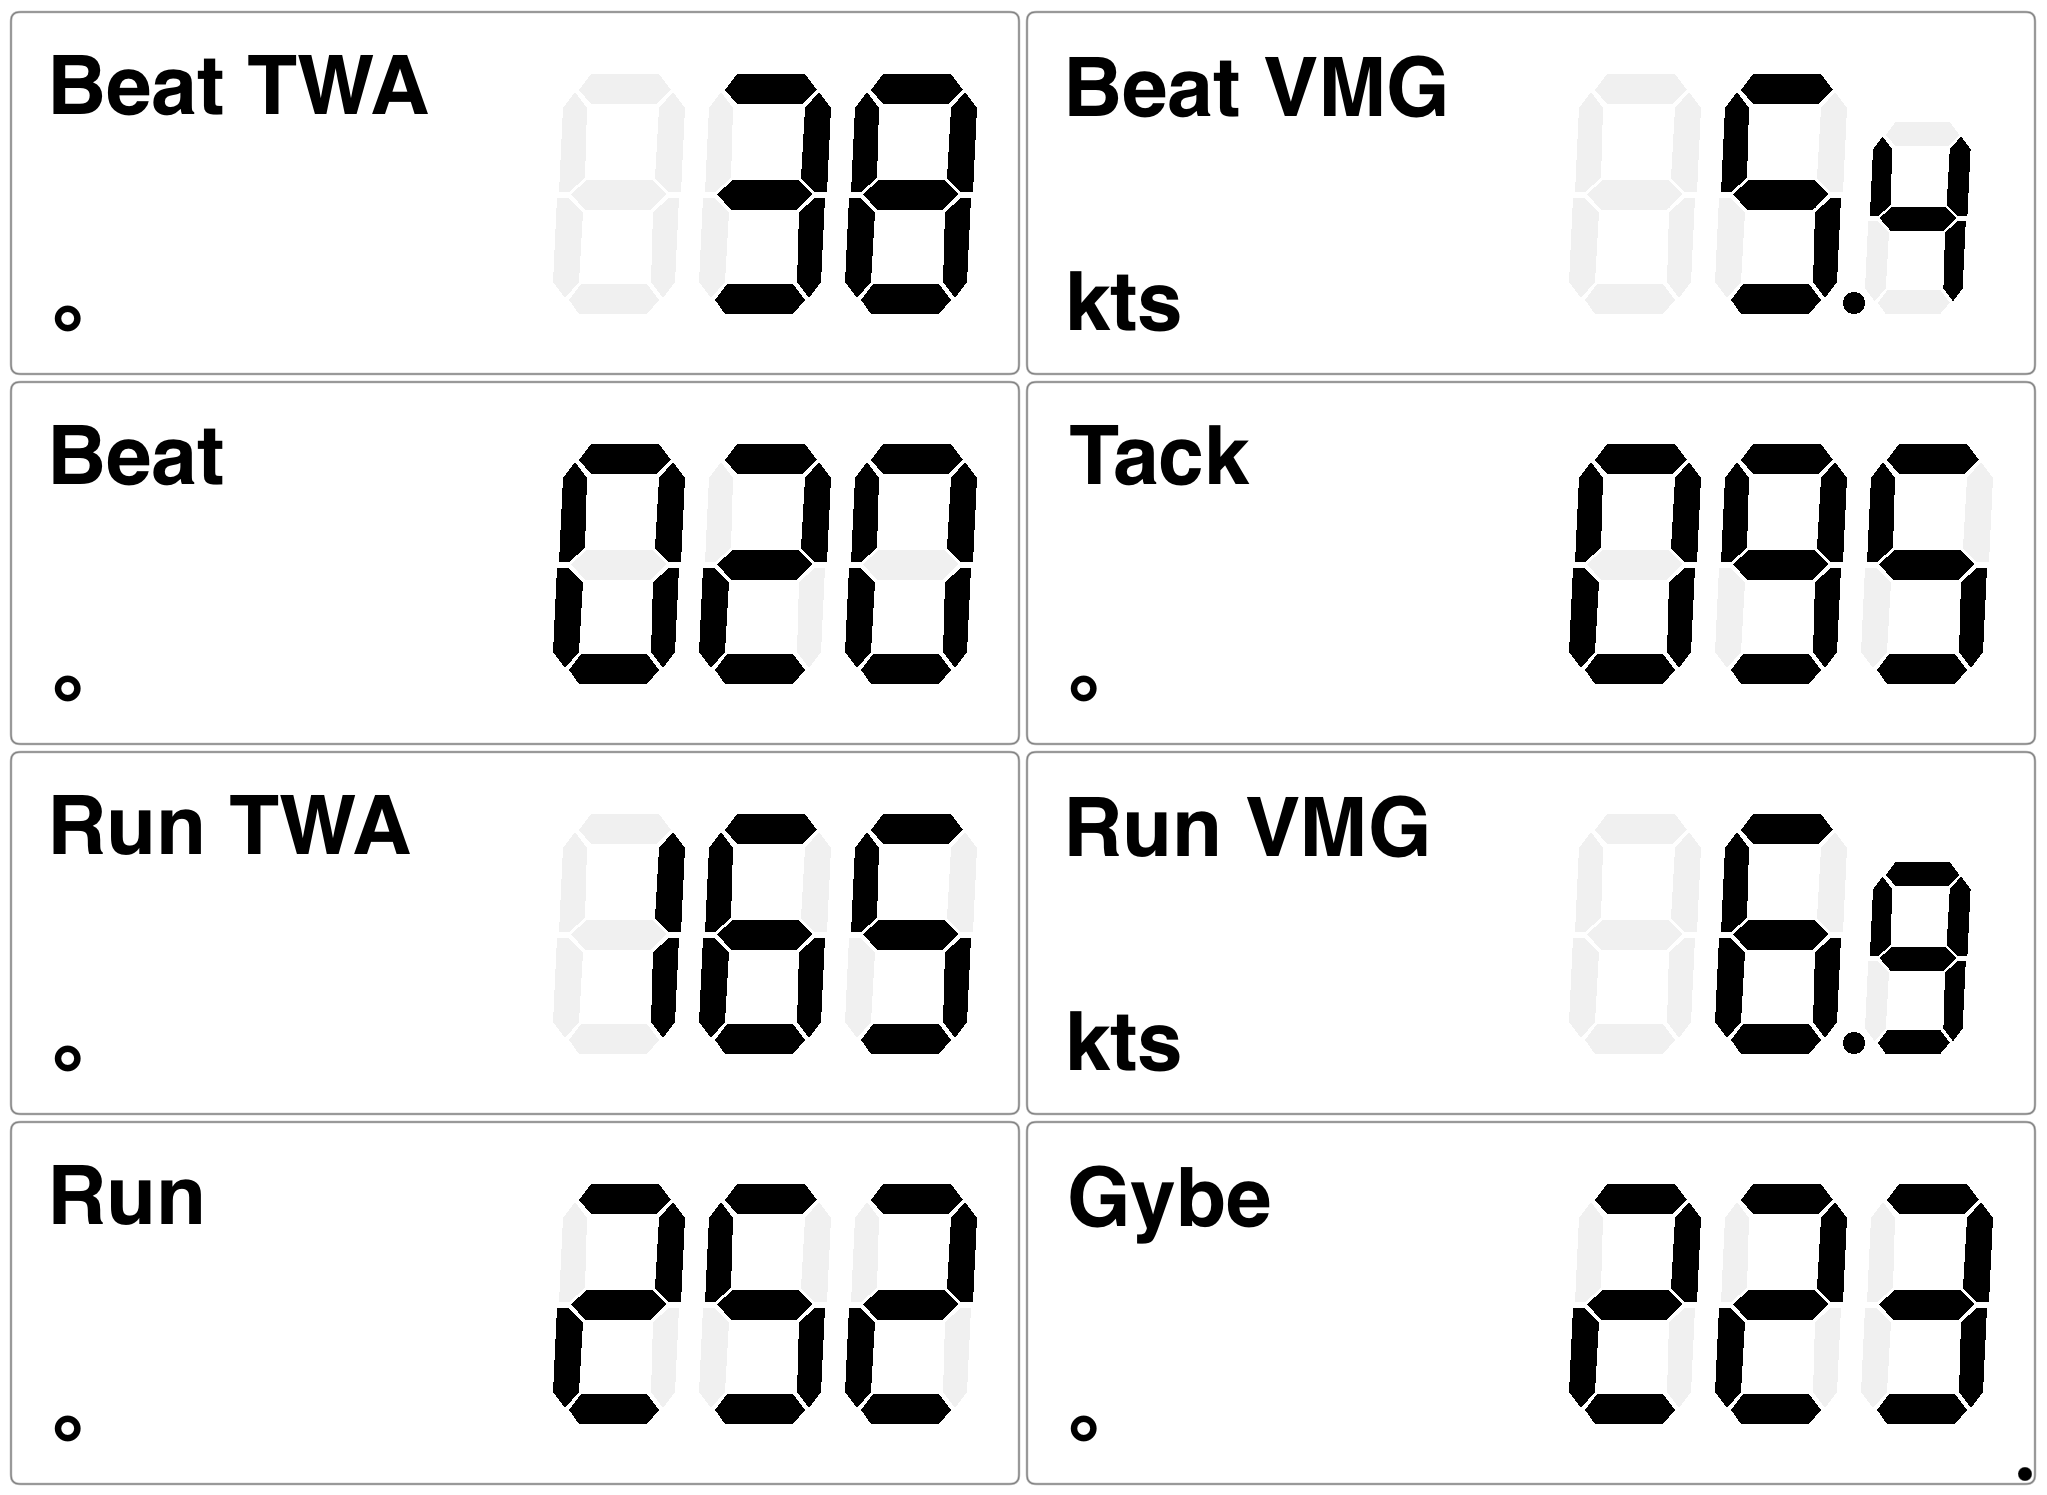
This TWA is called Beat TWA and the polar speed for this TWA is the Beat Speed. The VMG for this TWA is called Beat VMG.
So to find the fastest way to windward, you have to sail where the VMG is best and this is at Beat TWA.
For going downwind you have to choose the lowest horizontal line or point on the plot. This gives the Run TWA, Run Speed und Run VMG.
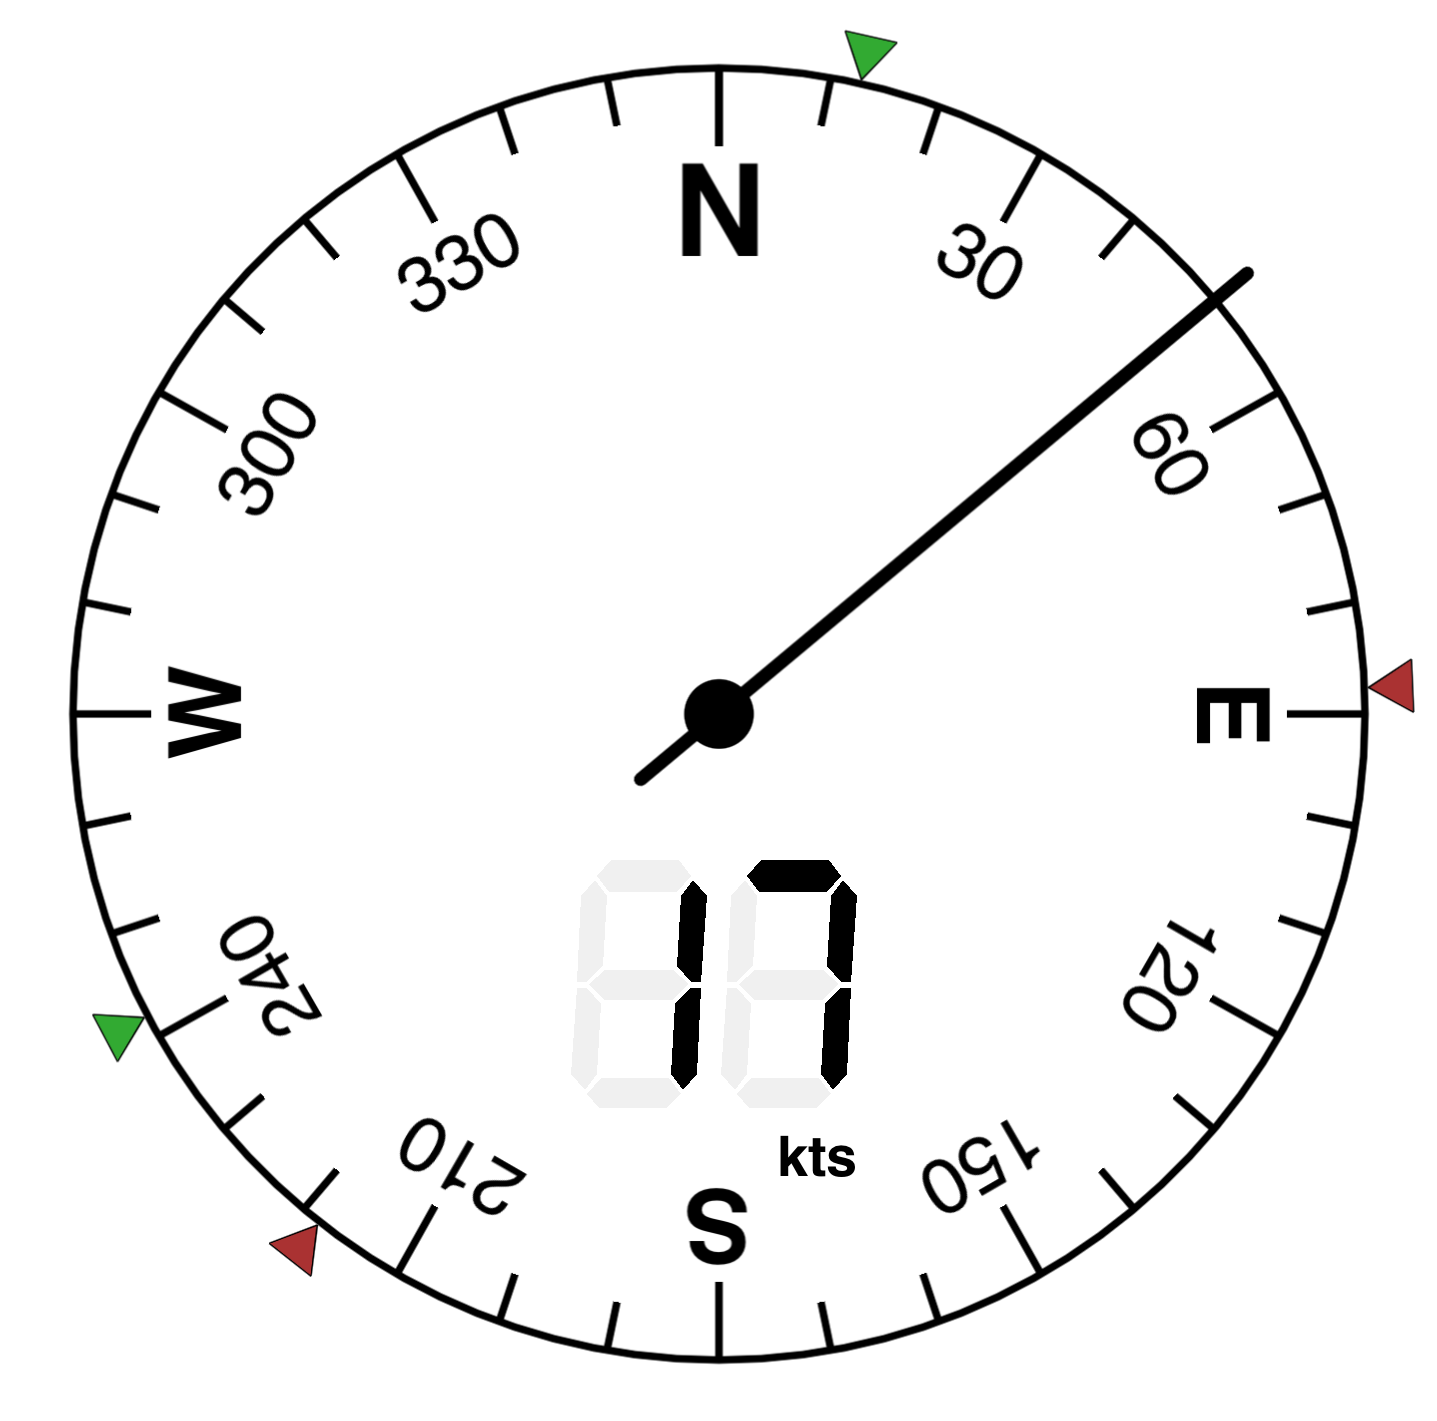
NMEAremote has many options to show these values Either as simple readouts, adding small markers to the the wind gauges or bar indicators on the wind readouts telling that you should head up or fall off. So it is easy to find the targets.


Saying the word Target, this is often misused when meaning Polar Speed. The Target Speed is the Beat SPD when going upwind or Run SPD when going downwind. That’s all, but it sounds more sophisticated. Also for Target TWA & Target VMG.
NMEAremote recognises if you are on a beat or a run and sets these Targets.
If the true wind direction (TWD) is also available (which just needs the compass value) NMEAremote will calculate the headings for the beat and after a tack. Same for running and gybing.
Last but not least one word to VMC (Velocity Made Good on Course). This value is the velocity portion towards the next waypoint. If the direction of this waypoint is inside the tack or gybe angles, the Targets stays the same. But heading to a waypoint on a reach is a different story. The simplest way is to sail to this direction as fast as you can. The VMC will be nearly optimal.
Another tactic is to find and sail the optimum VMC, react and adjust at wind shifts to the new optimal VMC and so on. Finding the Targets for this scenario is not implemented in NMEAremote at the moment but will be available in a future release.
Polar File Formats
A polar file contains the table representation of the polar data. A problem is that there is no standard definition for these files. As some navigation and routing programs are supporting polars, the big players have defined their own format. Here is an overview of the most common polar file types which will be recognised by NMEAremote.
In general they are all CSV (Comma Separated Value) text files. This means that the values are separated by rows and each row column by commas (sometimes by tabs or semicolons). The file extensions are either .csv, .txt or .pol (a pseudo file extension for polar). An advantage of these csv files is that they could be opened and edited or generated with Excel (Numbers on Mac).
A usual CSV polar file looks like:
| TWA\TWS | 0 | 4 | 6 | 8 | 10 | 12 | 14 | 16 | 18 | 20 | 22 | 24 | 26 | … |
| 0 | ||||||||||||||
| 5 | ||||||||||||||
| 10 | ||||||||||||||
| 15 | ||||||||||||||
| 20 | ||||||||||||||
| 25 | ||||||||||||||
| 35 | ||||||||||||||
| 45 | ||||||||||||||
| 55 | ||||||||||||||
| 65 | ||||||||||||||
| … | ||||||||||||||
| 180 |
This layout defines the wind angles (TWA) by the rows and the wind speeds (TWS) by the columns. Each field contains the predicted polar speed in knots.
The rule is that the first line starting with “TWA/TWS” (sometimes “Windspeed” or only “TWA” by MaxSea, Adrena and SailGrib) defines the TWSs, and the the first column of each row defines the TWA.
Because polar speed for 0 kts. TWS or TWA less than 20° are irrelevant these rows/columns could be missing. The scale of TWA and TWS depends on the software which generates the polar.
The POL (.pol) format is the same except is uses a TAB as separator.
The ORC export polar format extends the CSV format by adding beat & gybe angles and their VMGs.
| Wind velocity | 6 | 8 | 10 | 12 | 14 | 16 | 20 | |
| Beat angles | or: “UpTWA”, “Up. Bt.” | |||||||
| Beat VMG | or: “UpVmg”, “Up. Vmg” | |||||||
| 52 | ||||||||
| 60 | ||||||||
| 75 | ||||||||
| 90 | ||||||||
| 110 | ||||||||
| 120 | ||||||||
| 135 | ||||||||
| 150 | ||||||||
| Run VMG | or: “DnTWA”, “Dn. Bt.” | |||||||
| Gybe angles | or: “DnVmg”, “Dn. Vmg” |
Another format supported by NMEAremote is the Expedition polar format. The definition of the values is completely different and more complicated to understand.
- The first line starts with a “!” and could be followed by other words like “!Expedtion polar”, “!Elan 47”. Optionally it can start with “pol“.
- Each line consists of one windspeed curve for the wind angles and the windspeed is defined by the first value
- The windspeed of a line is followed by TWA – Boat Speed pairs/points.
- The second TWA pair is for the best upwind VMG for this windspeed. The next to last one is for the best downwind VMG.
- Thus there must be at least 3 points per curve.
!Expedition polar
6.0 	0	0	42.9	5.36	60	6.36	75	6.58	90	6.70	110	6.53	120	6.14	135	5.19	142.5	4.68	180	3.50
8.0 	0	0	42.7	6.48	60	7.24	75	7.37	90	7.60	110	7.38	120	7.06	135	6.41	143.2	5.86	180	4.50
10.0	0	0	39.7	6.69	60	7.67	75	7.88	90	8.01	110	7.93	120	7.66	135	7.14	153.8	6.19	180	5.00
12.0	0	0	38.3	6.84	60	7.87	75	8.17	90	8.21	110	8.40	120	8.14	135	7.66	164.3	6.50	180	6.00
14.0	0	0	37.6	6.94	60	7.99	75	8.32	90	8.49	110	8.75	120	8.64	135	8.10	169.8	6.97	180	6.50
16.0	0	0	37.5	6.95	60	7.99	75	8.35	90	8.65	110	8.88	120	9.03	135	8.48	173.4	7.40	180	7.00
20.0	0	0	38.1	6.95	60	7.99	75	8.41	90	8.79	110	9.21	120	9.58	135	9.67	173.0	8.19	180	8.00
25.0	0	0	40.0	6.95	60	7.99	75	8.44	90	8.95	110	9.55	120	10.12	135	10.60	174.0	9.45	180	8.90
Where to get a Polar?
Creating a polar is a hard job and could be very cumbersome. To receive accurate values the polar has to be as accurate as possible. It is easier and almost satisfying to search for a suitable polar file.
Here is an overview where to find polar files:
I’ve tested and loaded a lot of them, some are really good, some have bad data and some are in the wrong format. If you have an ORC certificate I would recommend to look first here: ORC (Jan Pieter Waagmeest)
How to load a Polar in NMEAremote?
Activating a polar in NMEAremote needs three steps: First get the polar on your device, then import it into NMEAremote and at least load it as an active polar.
1. Get the Polar on your device:
There are several options to get the appropriate polar file to your device. Either it could be downloaded from somewhere, attached to a mail/message or just copied into the device file system via iTunes File Sharing. Also files from the iCloud storage are accessible.
2. Import into NMEAremote:
To be available for NMEAremote the polar file has to be imported. This converts the polar into an improved format for faster processing and stores it in the internal Polar “store”.
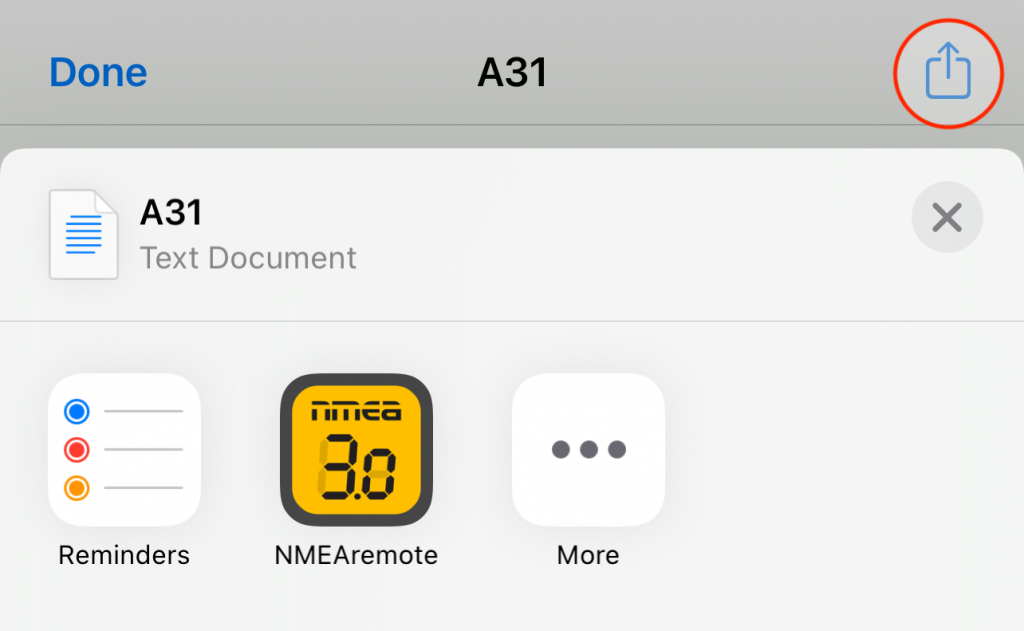
One way is to use the Share button of a file and select NMEAremote. This share button (e.g. also used for printing) is available when the file is opened in the file preview of the device.
This opens NMEAremote, imports and activates this file automatically.
Another way is to open NMEAremote and go to the Settings/Polar. Either the current active polar or the list of imported/available polars will be shown.
To import a new polar file, push the “File” button which opens the iOS file browser to select the Polar to import.
3. Activate the Polar:
At least navigate to the list of Polars at Settings/Polar or Settings/Modules/Performance and just activate its checkmark. You will see immediately its plot and table.
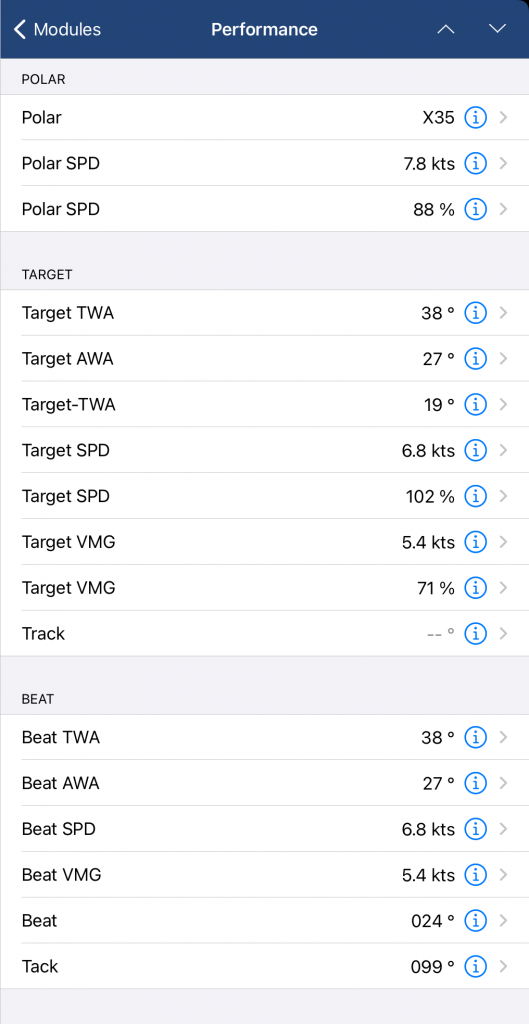
To verify and having a compact overview of the polar values just navigate to the Performance-Module.